This post came out of a talk I gave to a group of mentees, prompted by questions they had around how to do estimation and how to know they were working on the right priorities. These are complex questions to which there are no single answers, but I aimed to give them some tools that could help.
Prioritizing
“If it’s a priority you’ll find a way. If it isn’t, you’ll find an excuse.” - Jim Rohn
Most prioritization techniques involve balancing “costs” versus “benefits”. How we define “cost” or benefit can vary. There are obviously very complex ways of doing this, through, say, econometric models, but in most cases we can “SWAG” our way to a relative ordering using pretty basic two-dimensional models, of which we will look at a few here:
The Eisenhower Matrix
“I have two kinds of problems, the urgent and the important. The urgent are not important, and the important are never urgent.” – Dwight D. Eisenhower
The Eisenhower matrix is arguably the most well-known prioritization tool there is. It’s a simple 2x2 matrix model (you’ll see a few of those here :-)) that is easy to comprehend. It is also known as ABCD analysis.
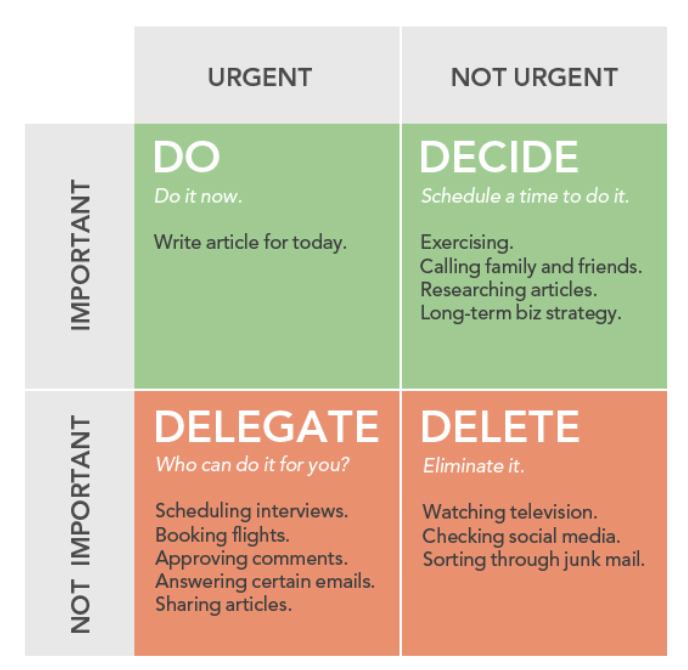
Personally, I think both bottom quadrants should be ‘Delete’; urgency should not of itself add weight to unimportant tasks (some of the the examples are bad).
The Action-Priority Matrix
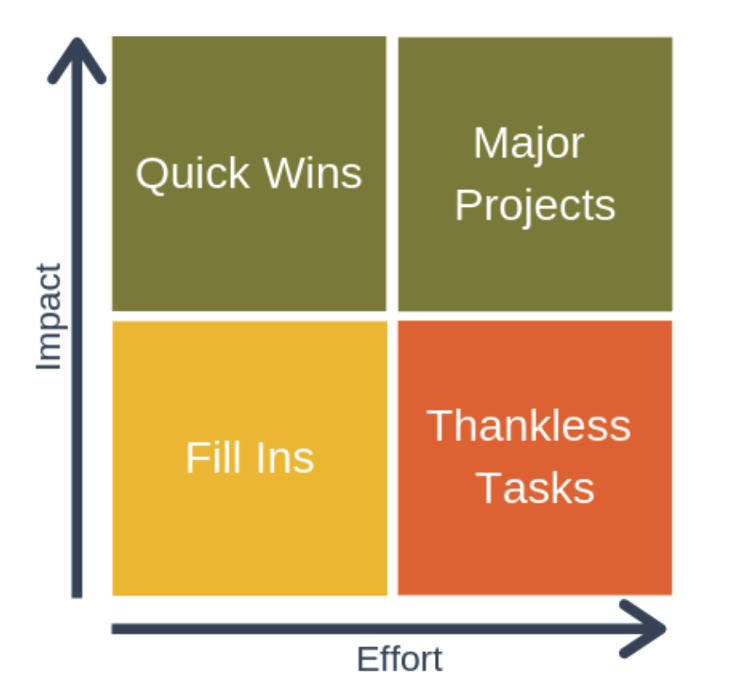
This model seeks to balance effort against impact. Another way to think of this is “business value” vs “development cost”.
If planning an iteration, you may want a mix of quick wins and progress on major projects.
“Fill-ins” are done only if you have gaps of time (or perhaps can be delegated). “Thankless tasks” may be worth trying to automate if they can’t be eliminated.
The Kano Model
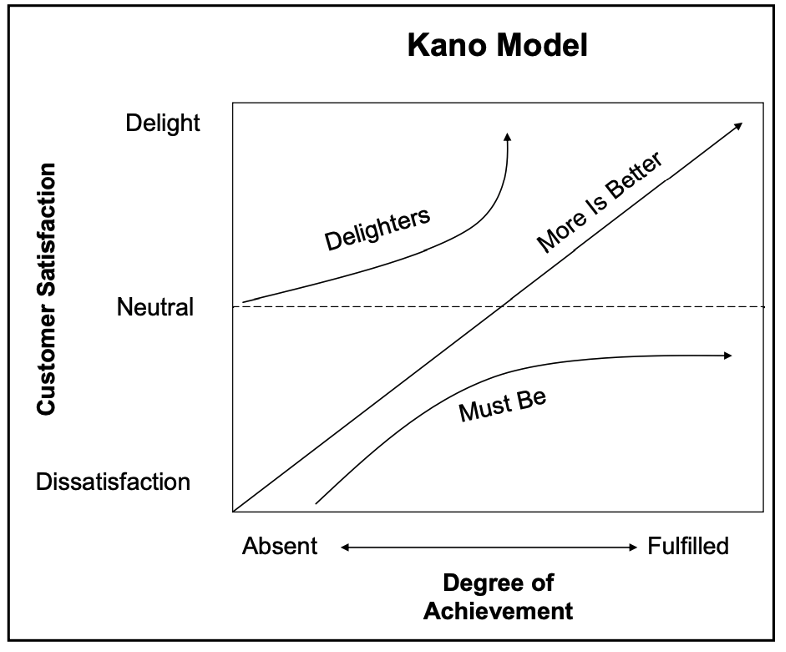
The Kano model examines factors that contribute to customer satisfaction. Some factors, if not fulfilled, lead to dissatisfaction, but if fulfilled will not delight the customer. For example, if a car does not run or is unreliable, it will lead to dissatisfaction, but a running engine is not a ‘delighter’.
There are also features where more is better, such as air conditioning, power windows, seats, and door locks, a CD player, etc. These factors may lead to dissatisfaction, but in the case of a fully loaded car, contribute to delight.
Finally, there are delighters. In terms of today’s cars, these might include GPS, luxury upgrades, extra safety features, etc.
The Risk-Value Matrix
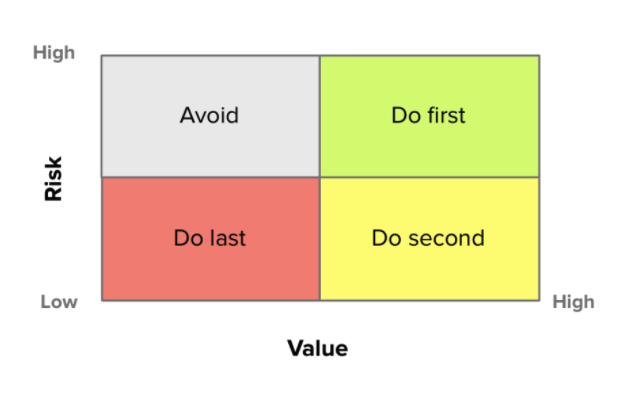
If this is a new project, build a minimal system that incorporates all dependencies and exercises CI, packaging, etc, to flush out dependency risks early.
For financial value, understand things like NPV and time value of money, cost of delay, opex vs capex, etc.
Be cautious of building services, as they can have high opex.
This model assumes you have to do the high-value tasks (otherwise you could focus on low risk/high value).
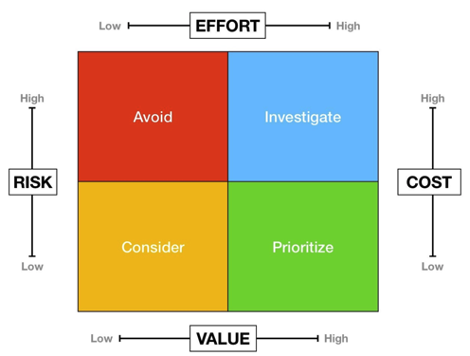
A variant of this is the Risk-Cost-Value-Effort matrix; although I’ve never really understood it properly, as it seems to be trying to plot four distinct values on 2 axes:
Deciding Priority as a Team
The above models are useful, but what if there is disagreement? How can you combine different opinions about priority into a collectively ranked set?
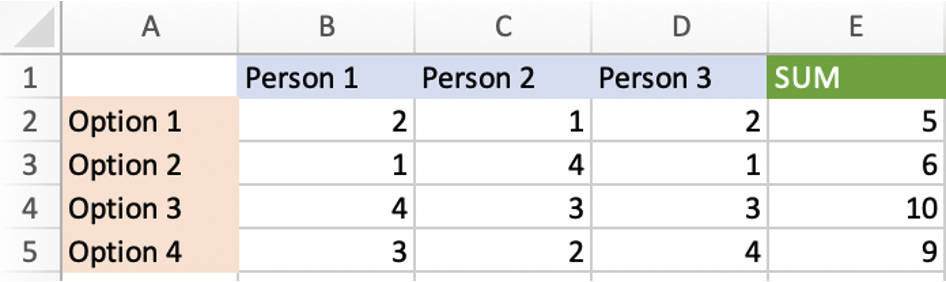
Nominal Grouping
- Each person ranks the options in the order they prefer, from 1..n
- Add up the totals for each option
- Order the options based on lowest sums
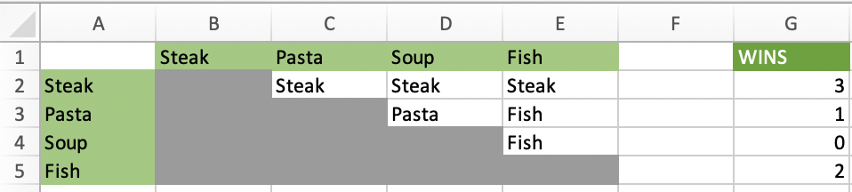
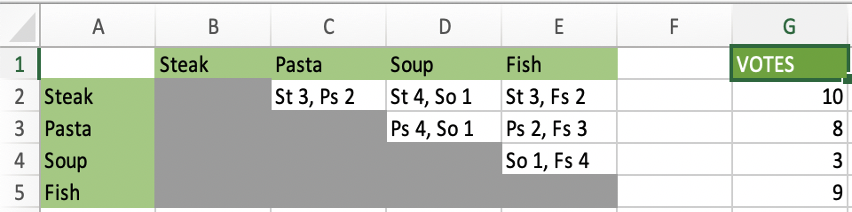
Pairwise Ranking
- Instead of comparing all items, compare each unique pair
- Sum up the number of wins for each item to get the rank
- Alternatively, you can vote on each pair and sum up the votes
This approach is useful because it is much easier to compare 2 items than to compare many items.
Estimating
“It is better to be roughly right than precisely wrong” - John Maynard Keynes
An Estimation Horror Story
- ~50 scrum teams involved in a cross-company initiative at company X
- The PM who was driving coordination of the teams created a PowerPoint slide where she wanted to figure out: “If we were to ship this year, what would the various deadlines be (for things like feature complete, stabilization, push to staging, etc)
- These were just “what-if?” constraints, with no input from the scrum teams
Guess what happened…
If you guessed that execs saw the PowerPoint and so this became the estimate, you win (or lose, depending on whether you were in one of the scrum teams or not).
The moral of the story is: be very careful around estimating. One person’s estimate is another person’s commitment.
Why are you Estimating?
- What decisions will come out of this estimate? Go/no go, resource needs, feasibility, budget, this vs that, …
- What precision (granularity) and accuracy (allowable error) is needed?
- What are the implications if it is wrong? What trade-offs might be possible?
- Is it better to be over or under? For low-stakes, a mid-point (50% likely) may be fine; for high stakes we may want 90% or more confidence
- What would the minimum be? Is that already too long?
You can’t Estimate what you don’t Understand
- If you don’t understand the problem, the correct answer is “I’ll get back to you”!
- Allocate some time to understand the scope of the problem
- If this is itself a significant task, make it a spike work item, and estimate that instead.
- If an estimate is large (more than a week), break the tasks down smaller.
Decomposing Work
We can decompose work:
- by phase (requirements, analysis, design, code, test) - this is typically how we would do things if following a waterfall approach
- by component (front end, backend, database, business logic, …)
- by functionality (e.g. user story)
Decomposing by functionality is the least risky, as it brings integration issues to the forefront and delivers value incrementally. That said, for the estimation part, you could consider other decompositions if it helps with understanding the problem.
Absolute Estimates are Hard
People are bad at estimation:
- we tend to be optimists, and think only of the golden path (and that gets challenged less as it is “good news”)
- we often forget of all the little things necessary for a task to be truly done
- Hofstadter’s Law: It always takes longer than you expect, even when you take into account Hofstadter’s Law
We can get good at using previous examples and experiences to evaluate new ones (t-shirt costing). We’re also not as bad at relative estimation - which tasks will take longer than others - or with affinity estimation – “these tasks are of similar size to those tasks”.
We can cluster tasks using affinity, then rank these clusters, and combine the results into t-shirt costing (S, M, L, XL) or story points – neither of these are units of time, but of relative effort.
What if you have to use Time?
- Understand: where does my own time go? When you say 3 days to finish, is it uninterrupted time? Do you even have 3 days to work on this?
- Be conservative with your days. Don’t think a day is 8 hours of productive time; it isn’t. Estimate in ideal days/hours, then adjust by actual capacity.
- Beware of precision bias – e.g. if you estimate 20 items in hours, add up the totals, and give the estimate in hours, this could be misleading. Better to round up the total to a more coarse-grained unit like weeks.
- Don’t be afraid to add buffer time – better to under-promise and over-deliver - but don’t go overboard. You want to give yourself wiggle room but not appear like you are obviously sandbagging.
Buffering
If you have flexibility on either dates or scope, you shouldn’t need to add buffering, provided you account for ideal hours != real hours. However, in a fixed scope fixed date project you must add a margin of safety. In a simple case you can add 50% for a reasonable buffer; in a more complex case with varying risk, you can estimate expected and worst case for each task, and use the RMSE (root mean square error):
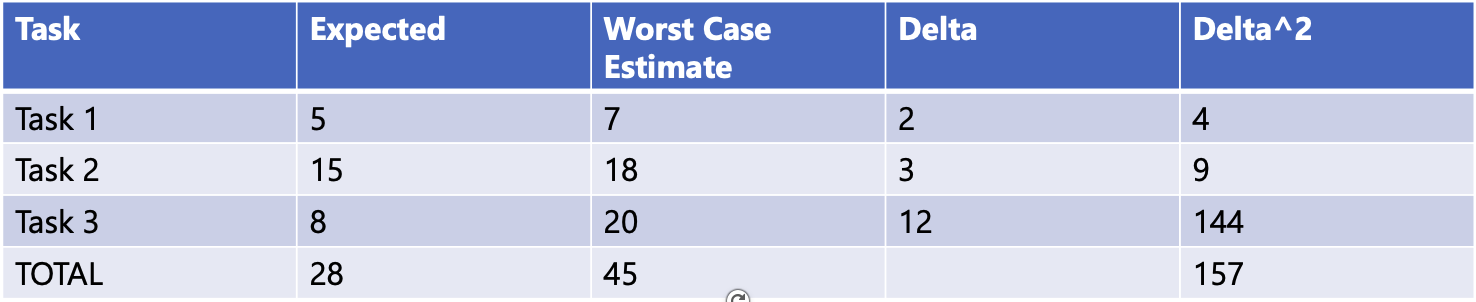
- base your worst case estimate on the risk tolerance for the project. 90% certainty is a good guideline
- in the example above, the RMSE is sqrt(157) or about 12.5 days, so the buffered estimate would be 40.5 days.
- note how the more uncertain (risky) tasks contribute much more to the buffer.
The buffer does not mean you can take it easy. It’s not “slack”, its for risk management. It should be an explicit part of the plan, not hidden. Watch out for Parkinson’s Law (“Work expands to fill the time available for its completion”).
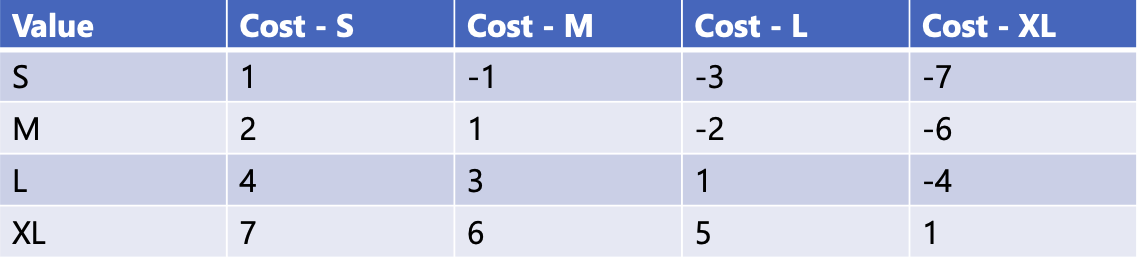
Incorporating Estimation into Prioritization
- Assign a t-shirt size for effort and for business value to each item
- Use a weight for each combination, and then rank items in weight order. Suggested weights:
Work-in-Progress (WIP)
“If you chase two rabbits, you will not catch either one.” - Russian Proverb
You may be familiar with this classic scene from “I Love Lucy”:
It's a great demonstration of the hazards of too much work in progress.We take on too much WIP for many reasons, including:
- It’s hard to say no. We want to please people and be team players. We defer to authority.
- We underestimate the effort involved in tasks
- We have unclear priorities
- New things are often more fun to start than existing things are to finish
But too much WIP has negative consequences, like:
- Delayed delivery and neglected work
- Increased costs and decreased quality
- Poor morale, and feeling overwhelmed
- Context switching, multitasking, and lack of flow (throughput)
- Harder to tell if our estimates are accurate or to use them as future references
WIP is a valuable metric and indicator.
- Little’s Law: Average Cycle Time = Average WIP / Average Throughput
Cycle time and throughput are trailing indicators of problems but WIP is a leading indicator. Think of getting on a busy highway: you can tell when getting on if it is congested (high WIP) that it will take a long time to get to work (cycle time). Without clear priorities, we often try to do things in parallel resulting in high WIP, so high WIP is a sign of unclear priorities – only one thing can be the most important thing.
Planning
“Prediction is very difficult, especially about the future” - Niels Bohr
Release Planning
Releases typically have a 3-6 month horizon, but could be as short as a one month. It helps to decide on success metrics up front (revenue, features, user growth,…).
Create a prioritized list of epics, user stories and estimates (only estimate the work that will reasonably make it into the release). You may not want to break all epics down to stories yet. Decide if this is a feature-driven or date-driven release. Revisit release plan regularly to see if it still makes sense.
Estimate by grouping tasks of similar size (affinity) and ranking the groups and assigning story points (use 1, 2, 3, 5, 8 only) with planning poker.
Estimate team velocity in story points per week (use historical data)
For a feature-driven release, add up the user story points and divide by velocity to get date. For a date-driven release, determine how many story points can fit and cut off list of potential stories at that point (and sanity check if this is a viable release delivering appropriate user value).
Iteration Planning
Start by picking user stories:
- Make sure the team has a clear Definition of Ready and Definition of Done
- Prioritize stories if not yet done, and estimate in points
- Determine capacity for the iteration in points
- Add known unusual sizable meetings/holidays/etc in plan, or reduce initial capacity to compensate
- Pick high priority stories for the iteration based on capacity. Aim for a coherent iteration theme rather than just taking the topmost stories.
Then go to the task level:
- Break stories down into tasks (one day or less). Do this collaboratively as a team as you will be more likely to capture all the tasks needed.
- Estimate tasks using ideal hours (may involve some design) and adjust for actual average daily capacity
- Sanity check hours against iteration length and adjust of needed
- Avoid assigning tasks, unless team members are specialists (in which case you want to make sure work is load-balanced)
An alternative is to do this “depth first” – pick one story, break it down, etc, then do next, until iteration is “full”.
To improve predictability:
- Know your velocity, and its variability
- Keep stories small
- Keep iterations short (I like one week sprints)
- Keep the backlog healthy (prioritized and estimated)
- Limit WIP
- Track cumulative flow (or burndown)
Tracking and Reporting
“What gets measured gets managed - even when it’s pointless to measure and manage it, and even if it harms the purpose of the organization to do so.” - V F Ridgway
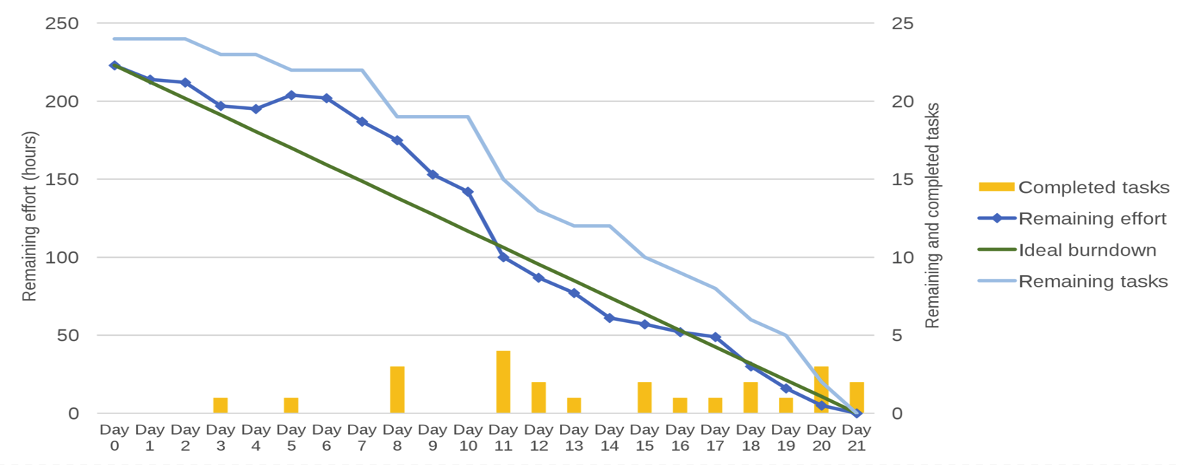
Burndown Charts
Burndown charts show remaining effort against time. You can fit a line to completed tasks to get a glide path which will show if you the actual estimated completion date. Increases indicate unplanned work that was added to the iteration.
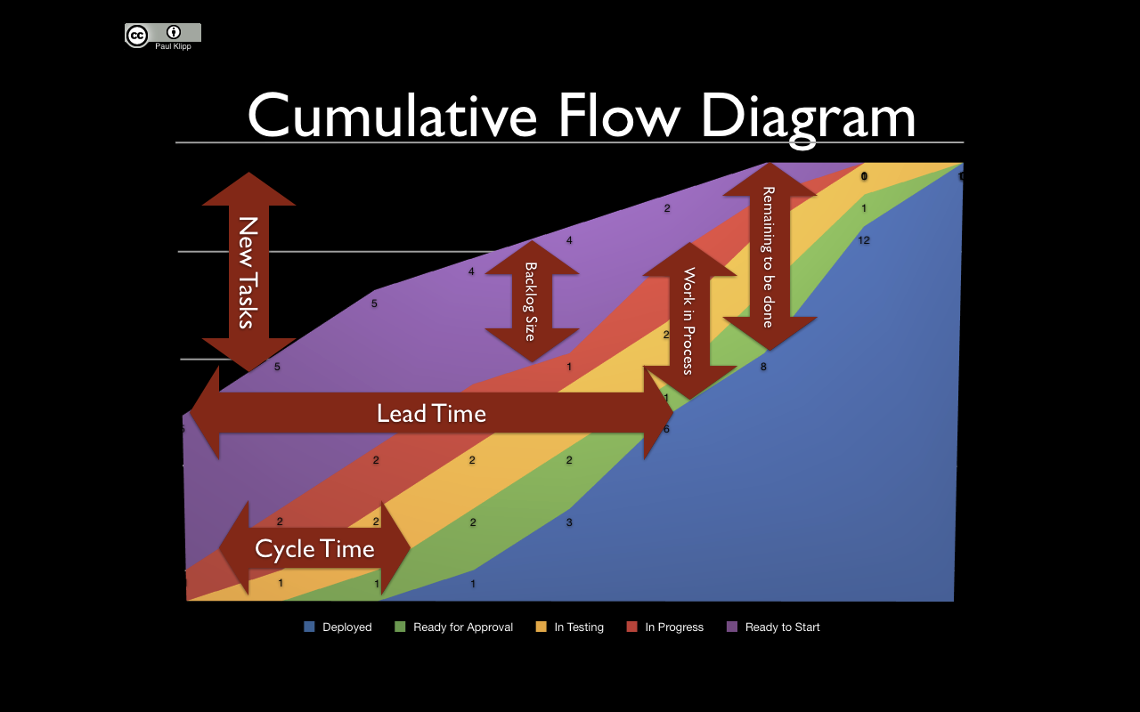
Cumulative Flow Charts
Cumulative flow charts are essentially inverted burndown, or “burnup” charts. They have the added advantage of showing how much WIP there is.
Having a Productive Day
“A bad system will beat a good person every time” - Edwards Deming
Get Clarity
Things you should get clarity on when you are given a task:
- Why? – it’s important to understand goals to get excited about things, and to help make sure you in turn can make the right decisions when things are ambiguous
- What? – What are the deliverables? What does “done” mean? What does success look like?
- How? – perhaps – this is situational
- With What/Who? – resource, constraints, collaborators
- When? – how is progress reported? Is there a deadline? What if it is not attainable?
Note: the more senior you are, the less you will get this handed to you, and the more you should be driving agreement up, down and across about these things.
Make Every Day Count
- Understand how much attention you need for different tasks so you can schedule activities for the optimal time of day (see “When” by Daniel Pink)
- Pick 3 goals for each day the night before or in the morning, and aim to complete those at least so you can call the day a success
- Use the Pomodoro technique to overcome procrastination, and give yourself small rewards
- Prioritize tasks to know what to work on next
- Focus on outcomes, not hours
Tracking Work and Keeping Notes
- Consider keeping an activity log so you know where your time and attention goes and can evaluate if it is being used wisely. This will help too with understanding your ideal hours capacity.
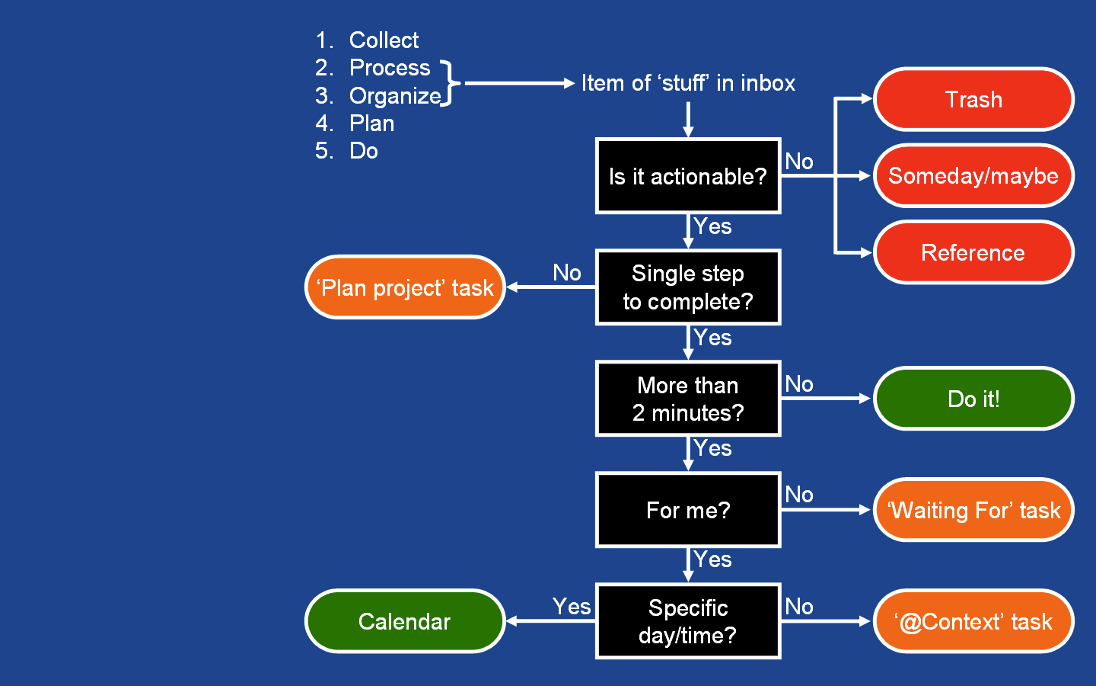
- Capture all your projects/goals and associated tasks in a GTD (Getting Things Done) project tracking system/TODO manager that can help show you next tasks for each project
- consider Bullet Journaling. I personally use a MacOS/iOS app called NotePlan which is awesome.
- For multi-task projects with deadlines consider using cumulative flow charts and glide paths to know if you are on-track